The MTBF and MTTR Paradox:
Why These Key Maintenance Metrics Don’t Tell the Whole Story
When it comes to maintenance management, MTBF (Mean Time Between Failures) and MTTR (Mean Time To Repair) are among the most widely tracked performance indicators. In almost every CMMS or EAM system, these two metrics sit front and center in reports and dashboards.
The logic seems straightforward:
- A higher MTBF suggests equipment is more reliable.
- A lower MTTR indicates that the maintenance team is efficient and responsive.
But in the real world, these metrics can sometimes tell a misleading—or even contradictory—story.
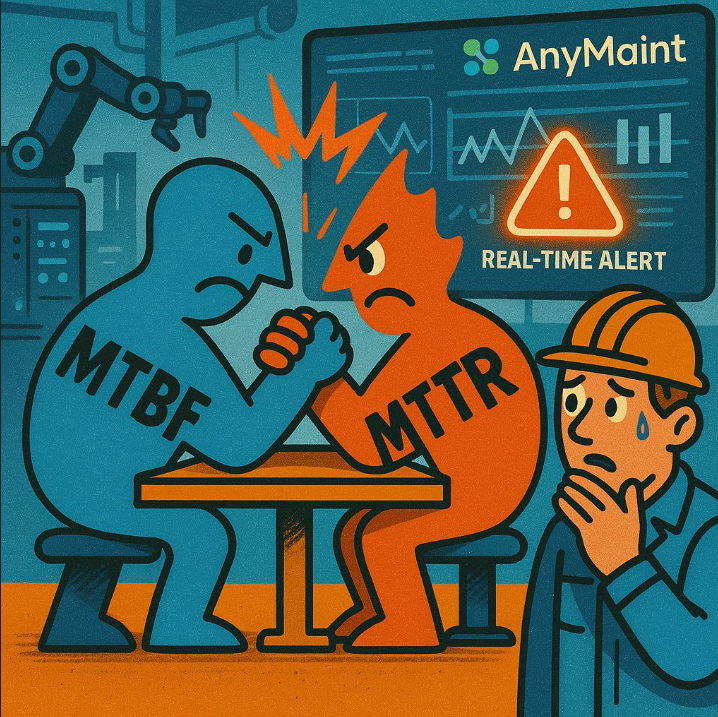
When Metrics Conflict: A Real-World Scenario
Imagine this: a particular machine begins to fail more frequently. As a result, the MTBF decreases.
However, the maintenance team becomes highly familiar with the issue and develops a quick fix. The MTTR improves.
So, what’s really going on?
- MTBF ↓ – Equipment is less reliable.
- MTTR ↓ – Repairs are faster and more efficient.
At first glance, one metric signals a problem, while the other suggests improvement. But in reality, this may be a case of recurring failures masked by operational efficiency. The underlying issue remains unresolved.
The Problem with Isolated Metrics
The core problem lies in evaluating MTBF and MTTR in isolation.
Without proper context, they can create a false sense of progress—or hide emerging risks.
For example:
- Fast repairs (low MTTR) might just mean the same issue is happening repeatedly.
- Long intervals between failures (high MTBF) might result from under-reporting of minor faults or gaps in the data.
Without a holistic view, you’re looking at numbers—not insight.
How to Analyze MTBF and MTTR Effectively
To gain meaningful insights from your EAM or CMMS software, MTBF and MTTR need to be part of a broader, data-driven approach.
Here are four essential best practices:
✅ Track trends, not just snapshots
Look at how MTBF and MTTR evolve over time, not just single values. Long-term trends reveal much more than isolated incidents.
✅ Correlate failure types with repair times
Are fast repairs associated with recurring issues? Are longer repairs tied to complex or systemic failures?
✅ Add qualitative context
Combine MTBF/MTTR with root cause analysis, failure codes, and technician notes to uncover patterns.
✅ Integrate across operations
Maintenance data doesn’t exist in a vacuum. Connect insights from your CMMS or EAM to production, quality, and safety data for a full operational picture.
Why Smart Maintenance Teams Use Advanced CMMS Tools
Modern CMMS (Computerized Maintenance Management Systems) and EAM (Enterprise Asset Management) platforms don’t just collect data—they help you analyze and act on it.
The right system will:
- Detect hidden trends in MTBF and MTTR
- Identify recurring failure patterns early
- Help prioritize preventive maintenance based on real impact
- Provide visibility across maintenance, operations, and leadership
At AnyMaint, we help industrial organizations go beyond basic metrics to uncover the real story behind their maintenance data. We combine technical KPIs with smart workflows and root-cause insights—so teams can prevent unplanned downtime and make better, faster decisions.
Conclusion: Metrics Are a Starting Point, Not the Full Picture
MTBF and MTTR are essential KPIs, but they’re just the tip of the iceberg. When used correctly, they can inform strategy. When taken at face value, they can mislead.
A powerful CMMS or EAM system will provide more than just numbers—it will surface meaningful insights, expose risks, and drive continuous improvement across your operation.
Want to learn more?
Let us show you how AnyMaint analyzes MTBF and MTTR trends to reduce downtime and optimize decision-making.
📩 Contact us today to schedule a personalized demo.
-
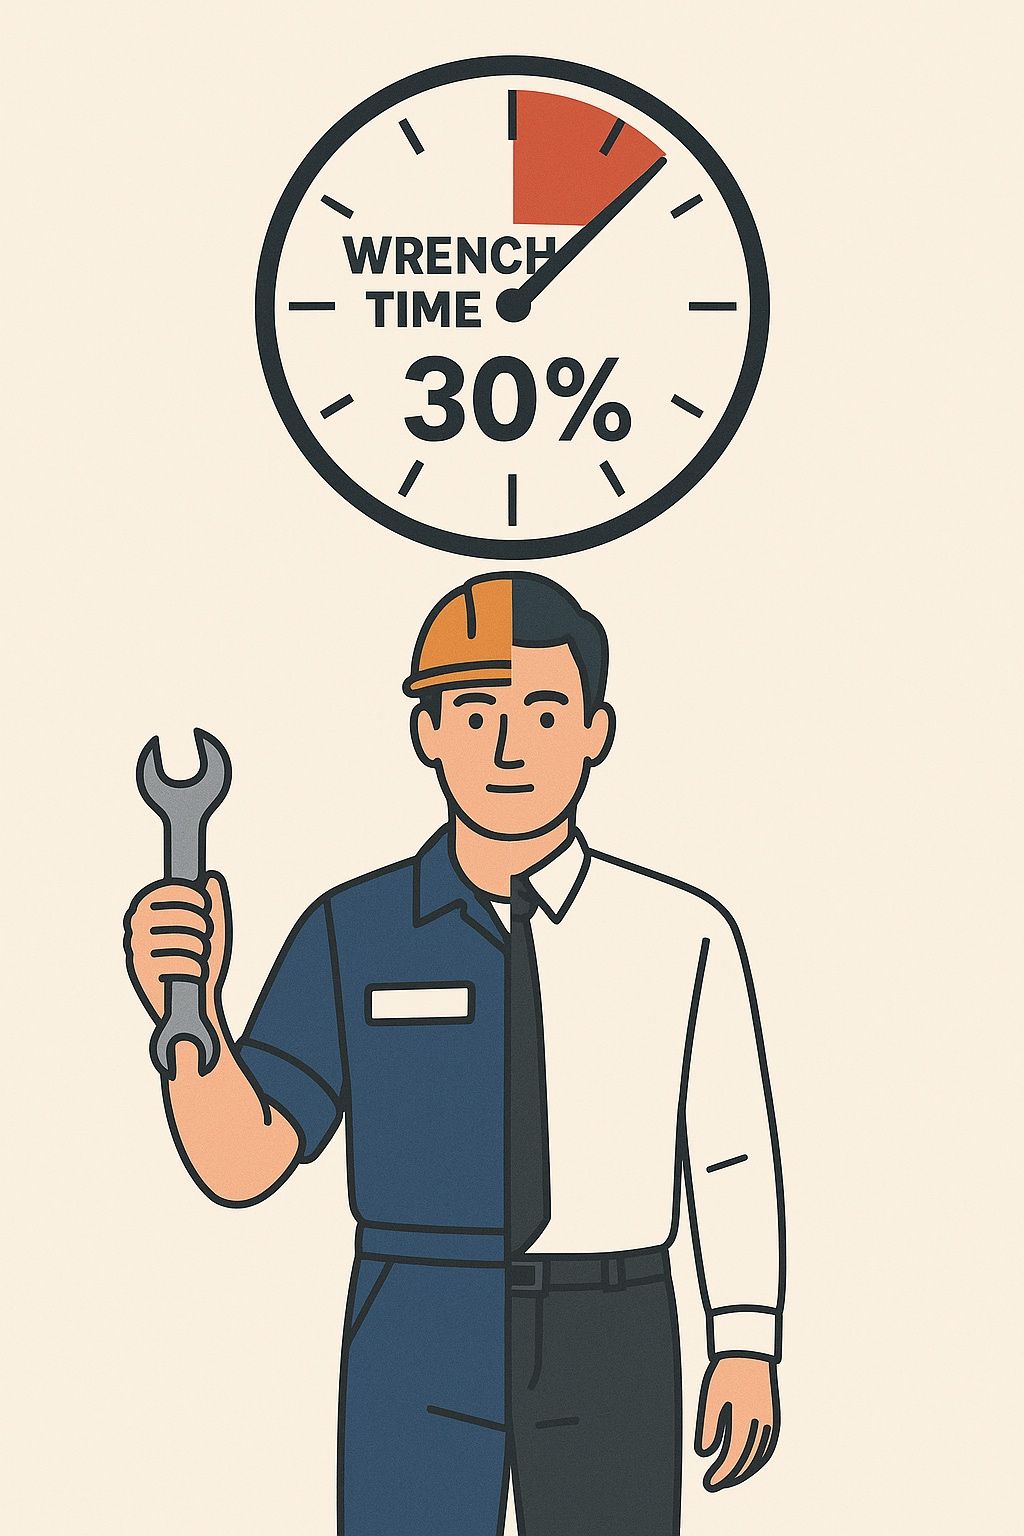 Read more03.06.2025How Much Time Are Your Technicians Really Turning Wrenches?Let’s talk about Wrench Time – the percentage of a technician’s day actually spent doing maintenance work: fixing, inspecting, greasing, testing. You know... the stuff they were hired to do. The rest of the time? It’s a mix of waiting for parts, tracking down paperwork, walking back to the office to ask a question, or trying to find the latest work instructions.
 -
 Read more21.05.2025Industry in Full Bloom: Welcoming Klil to the AnyMaint FamilyWe’re excited to announce a partnership with Klil, a company that’s spent the past 75 years proving that industry, innovation, beauty, and environmental conservation can thrive under one (beautifully designed) roof. Because when maintenance is done right — the results are beautiful.
 -
 Read more06.04.2025AI-Powered Code Reviewer: Smarter, Faster, and More EfficientKeeping code clean, efficient, and error-free is a challenge for any developer or software team. Traditional code reviews rely on manual effort, which can be time-consuming and inconsistent. But what if AI could automate and enhance this process? That’s exactly what AI Code Reviewer, an open-source Python script from AnyMaint, delivers.
 -
 Read more01.04.2025Elevating maintenance in the Food Industry!We’re excited to welcome Gad Dairy, one of Israel’s top dairy producers, as our newest partner! Since 1980, Gad Dairy has been blending tradition with innovation, delivering high-quality cheeses and dairy products. With AnyMaint’s AI-powered platform, Gad Dairy is taking a proactive approach to maintenance, ensuring seamless production and operational efficiency.
 -
 Read more31.03.2025Webinar: Partnering for success with AnyMaintA specialized webinar for consultants in industry, operations and information systems. We are pleased to announce that this Wednesday (2.4.25) we will be holding a specialized webinar for consultants and distributors. We invite you to join is at this unique webinar, where we will present AnyMaint - our innovative platform for maintenance and event management in equipment-intensive organizations.
 -
 Read more22.01.2025Predictive maintenance in the Pharma IndustryWe’re excited to welcome TAPI (Technology & API services) as our newest client! With over 4,500 employees, 13 global sites, and a portfolio of more than 350 products, TAPI continues to lead the way in advancing health through innovation. The pharmaceutical manufacturing and medical device sectors operate under strict regulatory demands with no room for downtime — every minute counts when you’re producing ingredients that impact global health.
 -
 Read more19.11.2024Overestimating Fancy Features in CMMS: Why Core Functions Should Come First.Overestimating Fancy Features in CMMS: Why Core Functions Should Come First. In the past two years, customers, investors, and collaborators have increasingly asked for AI features in Computerized Maintenance Management Systems (CMMS). Yes, we have them. In fact, we release new, cutting-edge features all the time. But let me be frank: it’s a bit like selling a Stradivarius violin to a second-year music student. Sure, it’s better than a standard instrument and can elevate performance, but is it really the first thing to consider when buying an instrument? Probably not.
 -
 Read more20.10.2024Exciting Partnership Announcement: AnyMaint & Israel PoliceWe are thrilled to announce that AnyMaint - AI-Powered Enterprise Maintenance is starting a pilot with the Israel Police to enhance their maintenance management and operational efficiency!
 -
 Read more18.09.2024New Customer: Sam-On (Meditec)Sam-On (Meditec), established in 1946 in Tel-Aviv, is a third-generation family-owned company. They specialize in developing, producing, distributing, and marketing pharmaceuticals, nutritional supplements, and medical devices. Their commitment to high-quality, innovative products and maintaining top GMP standards is inspiring.
 -
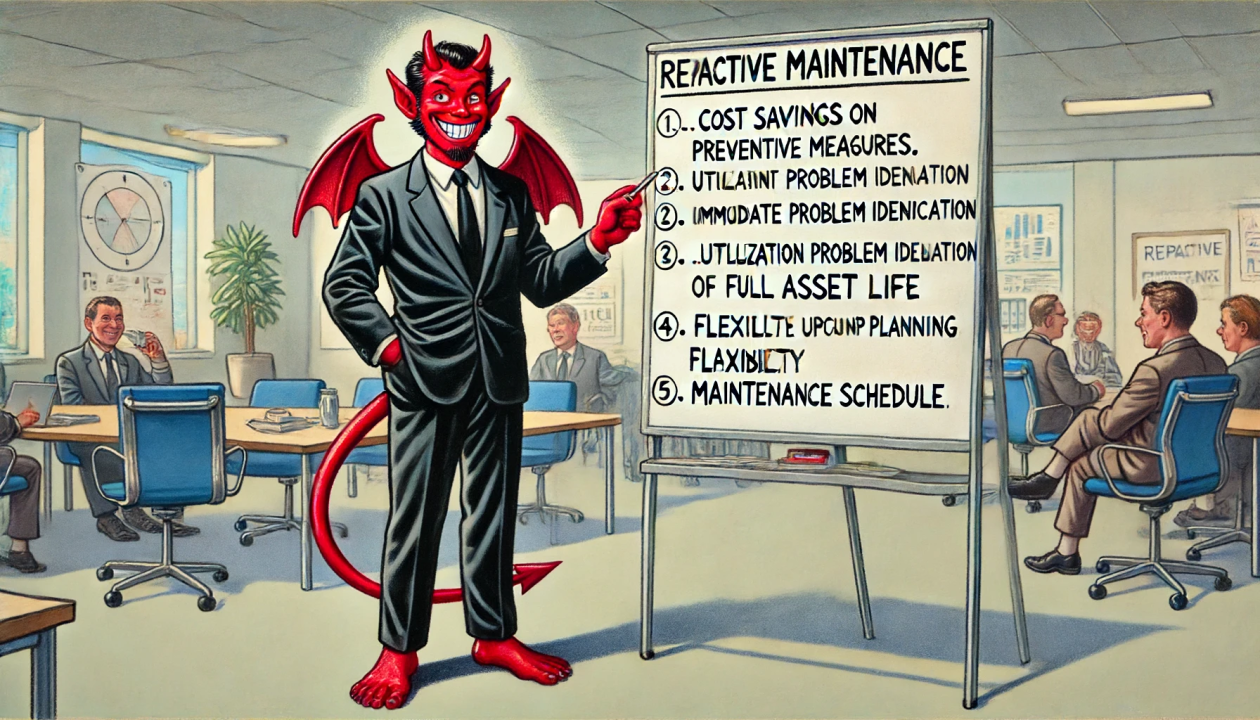 Read more15.06.2024Reactive Maintenance: A Necessary ChallengeIn the world of industrial maintenance, reactive maintenance often gets a bad reputation. However, it remains a necessary part of any robust maintenance strategy. Here are our key insights:
 -
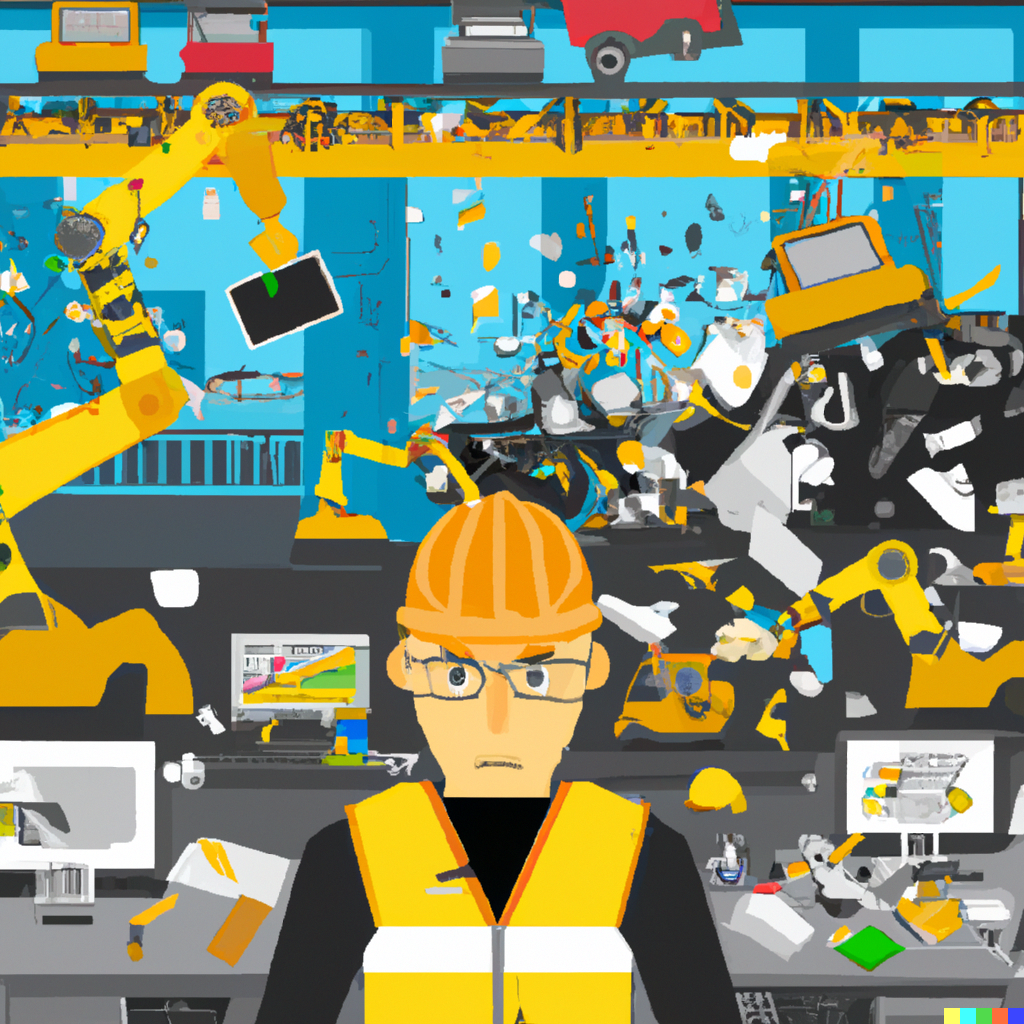 Read more09.05.2023The Dark Side of Maintenance Management Software: Why High-Tech Solutions May Not Be the AnswerThe potential downsides of using high-tech solutions such as software, IoT devices, and analytics in maintenance management. While these tools promise to streamline maintenance processes and increase efficiency, they can be time-consuming and complicated to set up, leading to disruptions in a busy workday. Ultimately, it's important to approach technology with a critical eye and balance it with the expertise of skilled maintenance workers and managers.
 -
 Read more28.04.2023Streamline Maintenance Management in FactoriesMaintenance software can help streamline maintenance management in factories, with a focus on worker involvement and reporting. Using software for maintenance management reducing downtime, increasing productivity, and improving safety. However, skilled maintenance workers and managers play a crucial role in the success of maintenance management. Any new maintenance management tools, such as AI and IoT devices, must be designed to complement and enhance the work of maintenance workers and managers.
 -
 Read more06.04.2023Boost Your Manufacturing Maintenance with a Connected WorkforceA connected workforce can improve manufacturing maintenance management by optimizing asset performance, providing more accurate maintenance data, improving worker safety and compliance, enabling better engineering, and allowing for data-driven decisions. AnyMaint maintenance management platform provides a solution for companies to embrace the future of manufacturing maintenance management.
 -
 Read more06.04.2023Is Industry 4.0 going to eliminate maintenance?Industry 4.0 envisions maintenance through sensors, data analytics, and connectivity for real-time failure recognition. However, robot or software is not a replacement for skilled maintenance professionals. Predictive maintenance can detect failures earlier, but it cannot replace or repair parts. With faster detection, the number of repair requests will grow, and a strong maintenance team is necessary for timely fixing. Data leads the way for improvement, but managers must appreciate skilled maintenance professionals above all.
 -
 Read more06.04.2023How to compare CMMS (Computerized Maintenance Management System) systems.Comparing CMMS systems can be difficult as most offer similar features. Instead of relying on internet comparisons, companies should ask themselves key questions, such as who will be using the software, how many hours will be spent on it, and how much integration with other systems is required. Understanding their specific needs will make it easier to compare CMMS options and find the best fit for the organization. The goal is not to find perfect software, but rather software that fits the organization's needs and can be improved upon over time.